|
1
|
- Timothy Hoerning
Spring 2006
|
|
2
|
- Background math
- Visual aids
- Analog Signals and Recording
- Digital Signals
- Sampling into discrete time
- Quantizing
- Bits and bytes – PCM encoding
- Error and Overflow
- Digital Filtering
- Digital Effects
|
|
3
|
- A Base determines the maximum number represented by any digit in that
system
- Base 10 uses the digits 0—9
- Base 2 uses the digits 0—1
- Base 8 uses the digits 0—7
- Base 16 uses the digits 0—9 and A—F
- Base 10 are the decimal digits we are all familiar with.
- Base 2 is used in the binary number system represented by computers
- Bases 8 and 16 are used as short hand for representing binary numbers
|
|
4
|
- Powers – Multiply by
itself times
- Logarithms – the base
logarithm of is
(the reverse of powers)
|
|
5
|
- We as humans have evolved a system of decimal digitals (due in part to
having 10 fingers or digits)
- A digital computer operates with just two states for any digit. Hence it uses binary digitals
- A bit is shortening of a binary digit.
- A byte is a short for of of “by eight”.
It is a group of 8 bits.
|
|
6
|
- Example: Decimal
- Each column in the number represents a different power of 10
- 1237 =
- 1 * 103 = 1*1000 +
- 2 * 102 = 2*100 +
- 3 * 101 = 3*10 +
- 7 * 100 = 7*1
- Example: Binary
- Each column in the number represents a different power of 2
- 10011010101 =
- 1 * 210 = 1*1024
- 0 * 29 = 0*512
- 0 * 28 = 0*256
- 1 * 27 = 1*128
- 1 * 26 = 1*64
- 0 * 25 = 0*32
- 1 * 24 = 1*16
- 0 * 23 = 0*8
- 1 * 22 = 1*4
- 0 * 21 = 0*2
- 1 * 20 = 1*2
|
|
7
|
- All binary systems have a fixed number of bits available to them
- If a calculation exceeds these number of bits, an overflow condition has
arisen.
- Overflows are typically flagged within the CPU, but at that point it is
too late as the data causing the overflow has already been combined.
- Overflows will be useful in 2’s complement math as we shall see.
- Digital Signal Processors use accumulator registers with extra precision
to combat overflow when multiple Multiply and ACcumulate (MAC) are used
in succession.
|
|
8
|
- Given the wide range of acceptable sounds, it is often beneficial to
represent the ratio of two signals in decibels
- If the upper signal is the desired signal voltage and the lower signal
is the noise voltage, than the ratio becomes a signal to noise (SNR)
ratio
|
|
9
|
- Two common method are used for visualizing signals
- Time Domain
- Frequency Domain
- MATLAB’s xpsound is a good introduction to visualization techniques
|
|
10
|
- MATLAB’s xpsound demo allows the user to explore the time domain, freq
domain and both at once spectrogram
- The signal shown on the bottom
left is the dropping egg.
- The curve in the left hand section represents the falling pitch as the
egg drops
- The line about 2/3 of the way through is the “splat” impulse. Notice the broadband nature of the
impulse
|
|
11
|
- Sound is the compression and rarefaction of air molecules
- An analog signal is an electrical signal where the voltage is analogous
to the input waveform
|
|
12
|
- Analog was the only form of signal processing for many years.
- Several methods of analog recording have come and passed
- Wax cylinders and disks
- Vinyl Records
- Magnetic Tape
- Analog typically involves some type of distortion. This is often considered as “warmth”
by analog purists
- RIAA preamp for records
- Saturation of magnetic tape
- The main problem is that analog is noisy (and distorted, etc). A certain amount of this noise and
distortion is added with each additional generation. Digital does not have this problem.
|
|
13
|
- Digital is concept; it is an abstraction.
- There is no such thing as a “digital signal” versus an “analog signal”
- A digital signal is assumed to have one of N levels
- The simplest signal uses 2 levels.
This is called a binary system and is what we will limit
ourselves to in this presentation.
- All data is transmitted or stored as a analog representation
- Cables carry voltages or currents
- Hard drives store things using magnetic particles
- Computer Memory stores electric charge
- Error free digital requires that the analog signal is not so degraded
in the process that it cannot be received uncorrupted.
|
|
14
|
- Resistance to noise
- As long as no errors are introduced, signal can be reconstructed and
duplicated perfectly
- If error correction is used, errors can be removed.
- The correct data can be recovered in the presense of noise.
|
|
15
|
- An analog signal exists in continuous time, continuous amplitude and the
frequency can potentially vary from –infinity to infinity
- To make a signal digital, we must to two things
- Sample the signal into Discrete Time
- Quantize the levels
|
|
16
|
- Signals can be converted into discrete time through the use of a sample
and hold device.
- This device samples the signal at a sampling rate (fs) which is much
greater than the input sampling rate of the input waveform. Each sampled signal is held until the
next sample is taken
- This sampling can be used with “bucket brigade” (discrete time) devices
or as an input to a quantizer (to be converted to a digital signal)
|
|
17
|
- Nyquist Sampling Theory states that the sampling rate of a system must
be twice the maximum input frequency
- In practice, because of realistic filtering, the maximum frequency is
limited to less than1/2
- If phase detection is required, then an even higher sampling rate should
be used.
- Standard sampling frequencies
- 8kHz – Telephone network – speech signals are nominally in the 300Hz to
3.4kHz range
- 44,100Hz – CD quality audio – theoretically 22kHz signals, ~16kHz in
reality
- 98kHz – new emerging standard for super high fidelity recording
|
|
18
|
- If a signal that exceeds the Nyquist sampling rate, it will be
incorrectly “aliased” to the wrong frequency in the digital domain.
- This is not common on commercially available audio equipment since they
include front end filters.
- For this reason, the digital domain is considered to have a periodic
frequency domain. The valid
range is from –fs/2 to fs/2.
Outside this are images.
- If a signal manipulation in the digital realm causes frequencies to be
adjusted or shifted, they will also be aliased to other frequencies
- When the signal is created via a D/A, it must be filtered to reduce the
out of band energy. These out of
band signals are called “images”.
|
|
19
|
- The most common form for storing a digital signal (and the only one we
will consider) is Pulse Code Modulation or PCM
- Simply, PCM assigns a certain code to each sample value 0 = 000 1 = 001, etc.
- Negative numbers are expressed in 2’s complement.
|
|
20
|
- There are multiple methods of expressing negative numbers in binary.
- One of the more common is 2’s complement. This is the only one we will consider
in this presentation
- Another method, sign magnitude, is common in digital signal processors.
- Consider a k bit system
- Positive numbers 0—2(k-1) are simply their binary equivalent
- Negative numbers are -2k— -1are set to the binary number
that will yield zero when added to the positive version. (ex, in a 3 bit system, 3 = 011, then -3 would need to be 101 because 011 +
101 = 1000, but since it is three bits, there is an overflow and that
is really 000 or zero)
|
|
21
|
- Consider a 4 bit system as shown in the graph on the left
- Note that the most significant bit is only one for the negative numbers
- Note that the system has one more negative number than positive. This number is typically avoided
|
|
22
|
- Quantizing a signal makes it discrete amplitude. Each held voltage is measured and the
closest level is selected as the level for that sample
- A k bit symbol takes on N=2k possible values. (ex, 8 bit signals have 256 levels
and 16bit signals have 65,535 levels)
- The example shown below is a 3 bit system
|
|
23
|
- The rounding process adds what is referred to as quantization noise.
- Another way to think about the quantization process is to consider the
input discrete time signal as your desired signal. Consider an imaginary signal that is
when added to the D.T. signal will create the digital signal. This imaginary signal is the noise
signal.
|
|
24
|
- The higher the number of quantization levels, the lower the quantization
noise.
- For a low number of levels (~<6 bits), the quantization noise can be
heard as correlated with the input signal
- For larger number of bits, the quantization noise can be modeled as an
independent Gaussian noise source.
- maxSNR=20*log10(2k) (ex, 16bit sound has a dynamic
range (or best case SNR of 96dB)
|
|
25
|
|
|
26
|
- If a signal exceeds the maximum value represented by the k-bit system,
then an overflow has occurred.
- If this is detected, the signal can be clipped to the maximum
level. This will result is some
distortion, but depending on the level of the clip it may be tolerable
- If unchecked, the signal will wrap around from the positive side of the
y-axis to the negative because of the 2’s complement
implementation. This will cause
a noticeable pop in the output waveform.
- The amount of signal level between the normal operating point and the
clipping point (or the input overflow point) is the headroom. Care should be taken in selecting an
input power level.
- Too low and the quantization noise will be apparent
- Too high and the headroom will be too low to handle the dynamics of the
signal
|
|
27
|
- The read state of a digital signal is determined by a threshold
- Above the threshold and the value is read as a 1
- Below the threshold and the value is read as a 0
- Once a bit is read incorrectly, it cannot be corrected unless error
correction is used
- Actual digital devices usually don’t use a simple threshold. Instead they have a valid 1 region
and a valid 0 region with a “dead zone” between them.
- Error Correction
- Used on some common formats such as CDs
- Adds overhead. Required storage
can be more than 2x that required to store data unprotected
- Still has it’s limits. Nothing
can correct all errors.
|
|
28
|
- Remember that with PCM, the Most significant bit determines whether a
signal is above or below the x axis.
- An error on this bit will create a large error
- The Least Significant Bit however determines which of two adjacent
levels is selected
- An error on this bit will create a barely noticeable error
- Sometimes Errors are intentionally introduced on the least significant
bits to encode extra information
- Robbed Bit Signaling – used the Public Switched Telephone Network
(PSTN) to indicate the status of the switch hook. The least significant bit is “robbed”
on every 1 out of 6 frames to encoded this.
- Audio Watermarking – used as a form of copy protection on CDs.
|
|
29
|
|
|
30
|
- Effects are used for one of two things:
- to imitate a sound but in a smaller form factor
- To create a new sound not previously realizable without the effect
- Many effects can be realized in the Analog or the digital domain
- The sound differences usually arise from “imperfections” in the analog
implementation
- Many people are used to the imperfections and find them more pleasing
- Some effects are uniquely digital such as delay
- Sometimes discrete time effects (such as bucket brigade based delay
pedals) are described as “analog”.
This is a bit of a misnomer since the signals are sampled. These effects to suffer from
distortion on very long delay times
|
|
31
|
- Multiply the input signal by the output of a Low Frequency Oscillator
(LFO). (maybe analog or digital)
- LFO can vary in shape (sine, square, etc.), frequency, amplitude
(typically referred to as depth)
- Can also use different phase LFOs to get a stereo effect.
- Graphs at right show Tremolo with sin and triangle wave modulation. Depth is set to about 50% and the
modulating signal is at 2Hz.
|
|
32
|
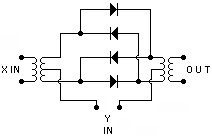
- Same notional schematic as the Tremolo.
Instead of LFO with variable depth, use audio freq with full
amplitude. (may be analog or digital)
- Output includes the sum and difference frequencies.
- Very non-musical effects. Sum and
difference frequencies are not musically related to input.
- Spectrogram below shows a sine-wave major scale starting at A=220Hz and
the output when mixed with a 400Hz fixed frequency.
|
|
33
|
- Filters are designed to allow some frequencies to pass unaltered (the
pass band), while some are attenuated (the stop band).
- Filters are described by the size and location of the bands and the
attenuation possible in the stop band
|
|
34
|
- Digital Filters can be implemented in one of two ways: feed forward only
(Finite Impulse Response - FIR) and feed forward and feed back (Infinite
Impulse Response - IIR)
- FIR filters are usually used because they are easier to design. IIR designs can lead to problems with
instability.
- MATLAB’s filtdemo provides an interactive method of learning about FIR
and IIR
|
|
35
|
- Active Filters by definition require a power source.
- Passive filters can only remove frequency components.
- Active filters can boost as well as cut frequency bands.
- Also allow for sharper transitions
- Allow multi-pole filters using solid state devices and capacitors
instead of inductors (allows for implementation in integrated circuits)
|
|
36
|
- Break Frequencies (or center frequency) – The frequencies at which the
response of the filter changes slope.
(i.e. the poles and zeros)
- Bandwidth – The width of the filter in the frequency domain. Usually defined at the point 3dB below
the peak signal amplitude.
- Q – The ratio of the center frequency to the bandwidth. Q is generally fairly low for audio
applications
- Boost/Cut Amplitude – Amount of amplification or attenuation obtained by
a filter. Typically specified in
dB with a range of +/- 10dB to +/- 20dB
|
|
37
|
- Named because it was designed to “equalize” the response of the
room. The goal was to use the
notches and peaks of the equalizer to compensate for resonances and dead
spots within a room
- Types
- Graphic
- Fixed center frequency, fixed Q, variable amplitude
- Spaced in octaves (or fraction of octaves, 1/2 octave or 1/3 octave)
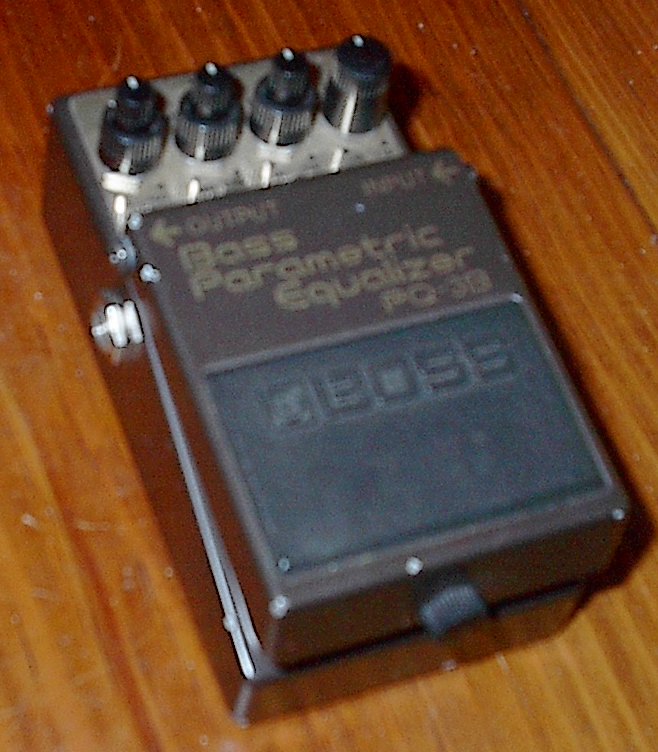
- Parametric
- Variable center frequency, variable Q, variable amplitude
- Typically only 3 or 4 bands
- Semi-Parametric
- Variable center frequency, fixed Q, variable amplitude
|
|
38
|
|
|
39
|
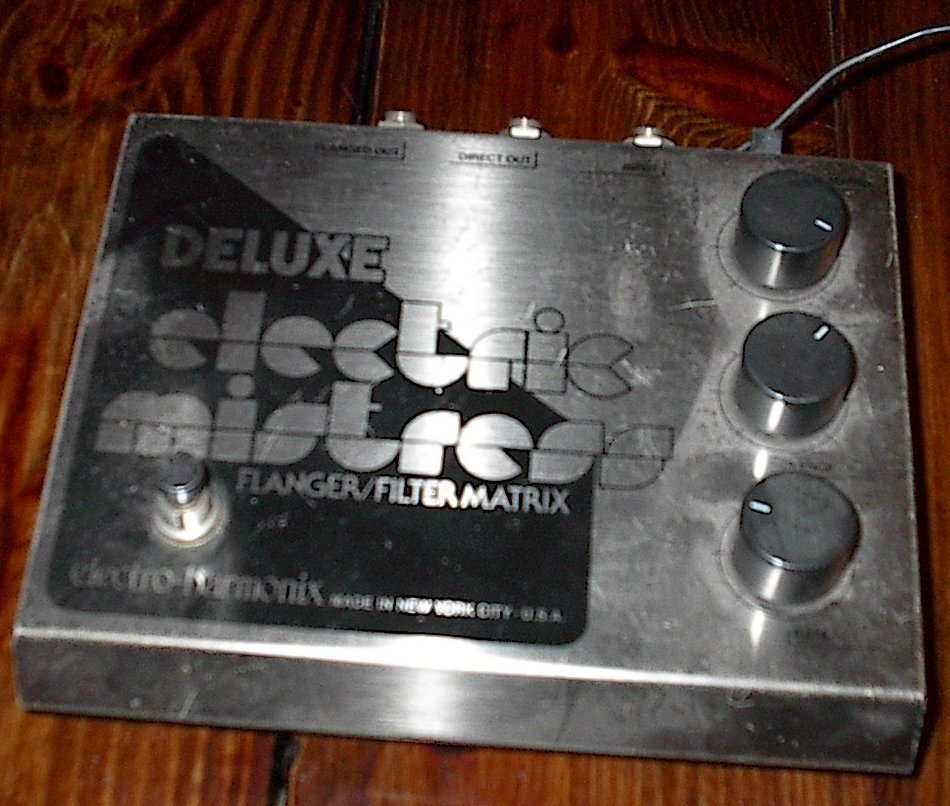
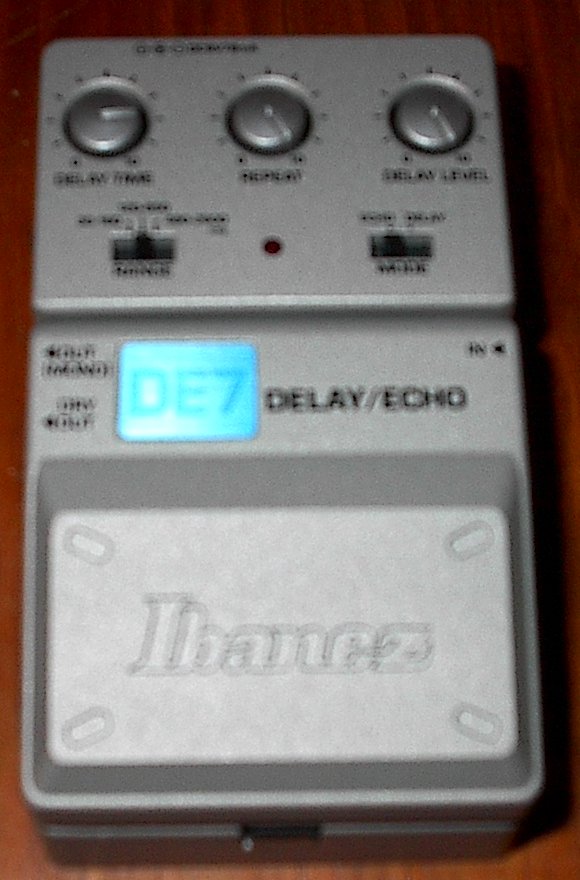
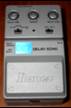
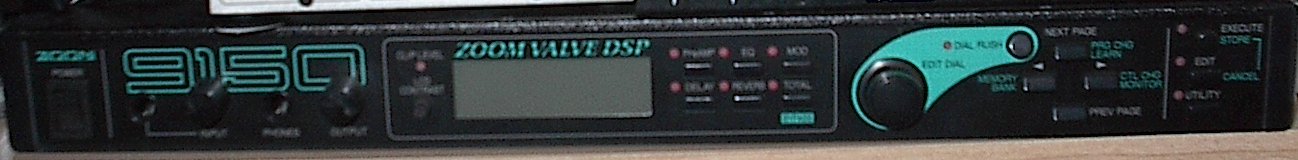
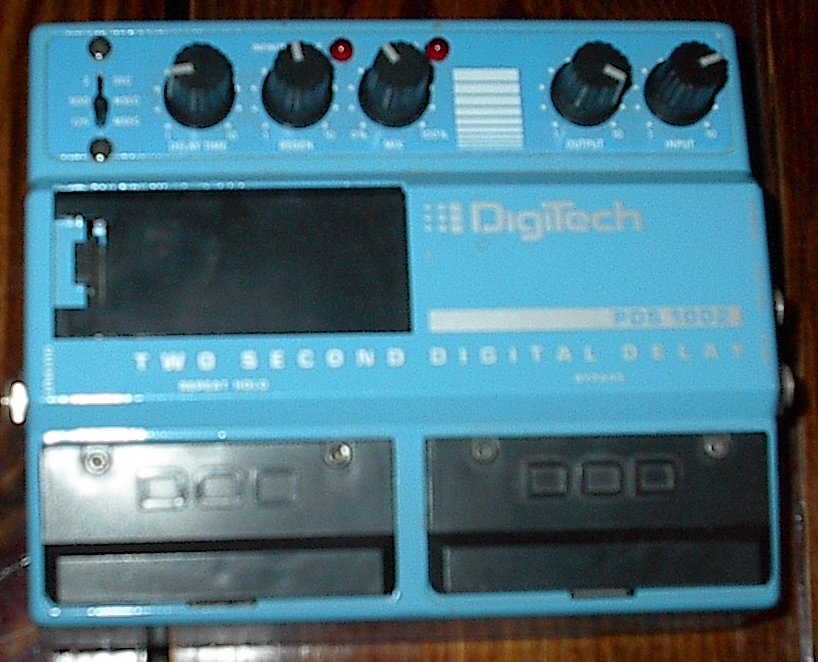
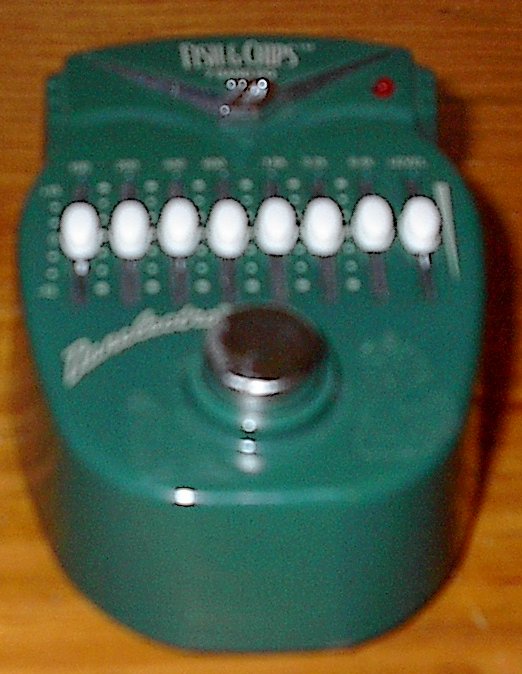
- Many guitarists talk about the difference between “analog” versus
digital delay based devices
- In truth, there are no completely analog delay circuits (except for
tape-echo units). In “analog”
delay pedals, the delay unit is a bucket-brigade chip
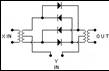
- A bucket-brigade chip is an integrated circuit with a large number of
capacitors and transmission gate transistors.
- The signal is sampled (into discrete time), and the sampled voltage is
placed on the first capacitor
- The sampled voltage is then passed to the next capacitor at the rate
determined by the sampling rate control.
- If the sampling rate is too low, the voltage on the capacitor will
“bleed” down and distortion will occur.
- This gives the signal a “warm” quality that many appreciate.
|
|
40
|
|
|
41
|
|
|
42
|
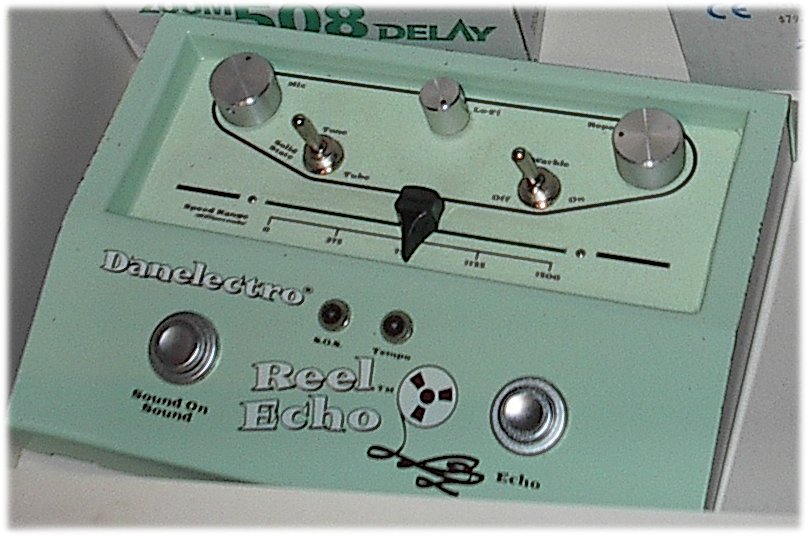
- Often there is no distinction between delay units and echoes. What usually makes a device more of an
echo is how it attempts to simulate a tape echo
- The feedback gain can be increased to be greater than unity. This will cause the echoes to
increase in volume and eventually saturate or oscillate
- The is some times a filter in the feedback loop to simulate the gradual
deterioration of signal quality that would occur with a tape-echo unit.
- Sometimes the delay time is varied slightly to simulate tape warble.
|
|
43
|
- While it’s not usually noticeable, simple delays are frequency
selective. It should be obvious
that a frequency and all its odd harmonics will destructively interfere
and cause nulls in the frequency domain
|
|
44
|
- Delays in a computer (or Digital Signal Processor) are implemented using
a circular buffer
- An input pointer writes the sampled values into memory
- An output pointer reads the sample values out of memory a fixed number
of samples later. The offset in
samples times 1/fs is the delay time
- DSPs have special registers that automatically wrap around the end of a
circular buffer.
|
|
45
|
- Reverb is designed to sound like the multiple reflections found in a
room or a hall.
- Many analog reverbs were created using a spring and transducers
- “True-convolution” is the newest trend in reverbs. This uses an impulse response from a
real location. The reverb is
effected by using a very long FIR filter
- Can use an FIR filter for early reflections with an IIR filter or the
trailing reflections
|
|
46
|
- As was noticed previously, delay elements can create notches in the
frequency domain.
- By changing the delay time continuously (at a sub-sampled value), the
notches vary in frequency
- The delay time is modulated with a low frequency oscillator (LFO).
- The following parameters determine the sound from a flanger
- Delay - The minimum amount of time the signal is delayed. (100 ms to 10
ms).
- Sweep depth (width) - How wide the sweep is in terms of delay
time. i.e., the maximum
additional delay time added as the LFO is swept (100 ns to 10 ms)
- Speed – the frequency of the LFO
|
|
47
|
|
|
48
|
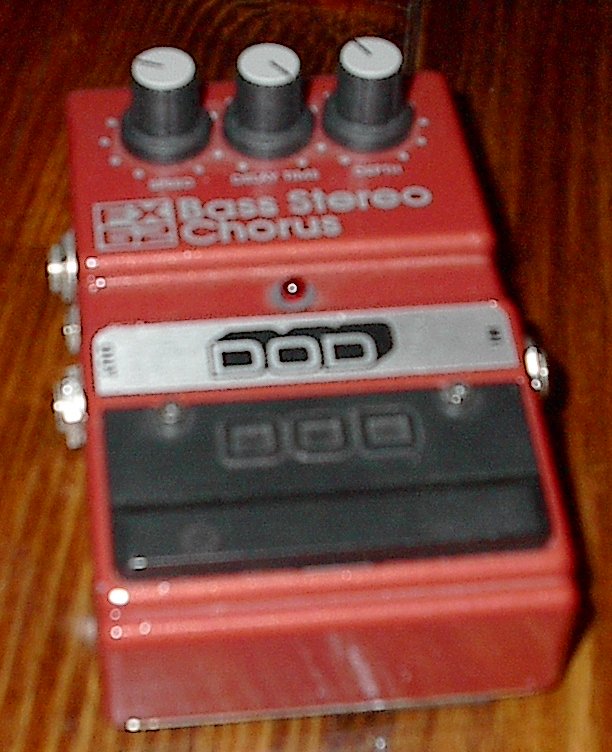
- Named because it makes one instrument sound like many. Fills up the sonic space in a song
- A chorus is merely a flanger with longer delay times (and usually no
feedback)
- The following parameters determine the sound from a flanger
- Delay - The minimum amount of time the signal is delayed. (20-30 ms).
- Sweep depth (width) - How wide the sweep is in terms of delay time.
i.e. the maximum additional delay time added as the LFO is swept (0 to
10 ms)
- Speed – the frequency of the LFO
- Extreme settings will create a vibrato – pitch warble
|
|
49
|
|
|
50
|
- Course for Junior EEs (or those with appropriate signal processing and
circuits background)
- Topics Covered
- Music Theory
- Reading the staff, building scales and chords
- Just and Equal temperament – sine waves to notes
- Effects processing
- Simulation of common effects in MATLAB (distortion, chorus, flanging,
delay, ring modulation, etc)
- Audio Synthesis
- MIDI (Musical Instrument Digital Interface
- Understanding the MIDI standard
- Decoding MIDI files
- Psychoacoustics and Lossy Digital Compression
- Psychoacoustics and human hearing.
- MPEG Audio Layer Standards (MP3, AAC, etc)
|
|
51
|
- Proakis, J. & Manolakis D.,
Digital Signal Processing, Prentice Hall, 1996; ISBN 0-13-373762-4
- Watkinson, J., The Art of Digital Audio, Focal Press, 2005; ISBN
0-240-51587-0
- Oppenheim, A. & Schafer, R., Discrete-Time Signal Processing,
Prentice Hall, 1989; ISBM 0-13-216292-X
- http://www.harmony-central.com/Effects/effects-explained.html
- O’Connor, K., The Ultimate Tone Vol. 1
- http://www.geofex.com/fxtech.htm
- http://www.freeinfosociety.com/electronics/schematics/audio/ringmodulator.html
|

 Notes
Notes